
Older Than You Think
There has been a lot of excitement in some circles about the recent release of the City’s PLUTO dataset into the public realm. For those of who are not planning/geography nerds, PLUTO is the compilation of lot-level information on every building parcel in New York City – everything from use, zoning and height to assessed value and much, much more (Andrew Hill has a great slideshow overview). Until a week or so ago, you had to pay $300 per borough for this trove of information (or work at a University or other institution with a subscription). $300 per borough per year if you want to keep your data set up to date.
But now it is all available for free – and people are already exploring the data and making pretty maps, like this map of building dates put together by BKLYNER [free for a taste; sub. req. after]. A word of caution though – the PLUTO dataset has an amazing breadth of information, most of it highly accurate and quite up to date.
Unless you want to know how old your building is.
The data for building age (YearBuilt) is so flawed that you really should just delete that column from your dataset. If you read real estate ads, you will see a lot of buildings listed as 1898 or 1901. That number probably came from city records, and odds are 10 to 1 that number is wrong. Now take those odds and apply it to the 857,879 tax lots citywide and get an idea of the problem.
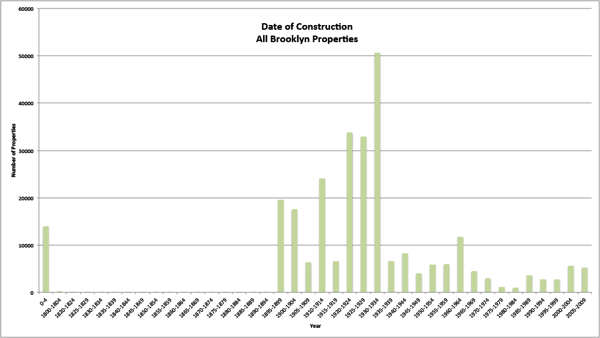
Data source: NYC PLUTO, 2010
If you look at the data, you can intuitively tell that something is wrong. A chart of 278,365 Brooklyn properties (above) shows almost no buildings constructed before 1895 (confirmed on BKLYNER’s map – note the dearth of blue and green buildings). The distribution of construction dates is heavily skewed to the early 20th century, with, paradoxically, the busiest five-year period of construction being 1930 to 1935 – the depths of the Great Depression (the “zero” bar represents vacant lots). PLUTO shows only 671 buildings in all of Brooklyn being constructed before 1895 – not even enough to register on the chart (the problem extends to Manhattan too, as the dearth of red on Hill’s map of 19th century makes clear). Think about that – according to PLUTO, in all of Brownstone Brooklyn and beyond, there are fewer than 700 buildings from the 19th century. Clearly there is something wrong here.
Looking at the number of buildings by year built, it is apparent that many buildings were assigned to five-year periods. Thus, 1920, 1930, 1925 and 1910 account for 40% of the buildings constructed. But there are also some dates that don’t fit the pattern – 1899 and 1931 each saw almost 20,000 buildings constructed; 1901, almost 15,000 (yet, only 22 buildings were constructed in 1902!). The explanation, I think is that 1899 represents the consolidation of Greater New York into a single municipal government, while 1901 may be a reflection of the enactment of the Tenement House Act of that year (it would have been important to know which buildings were “old law” and which were “new law”. 1931 is a puzzler – it may relate to the passage of the Multiple Dwelling Law in 1929, but that correlation there is less clear.
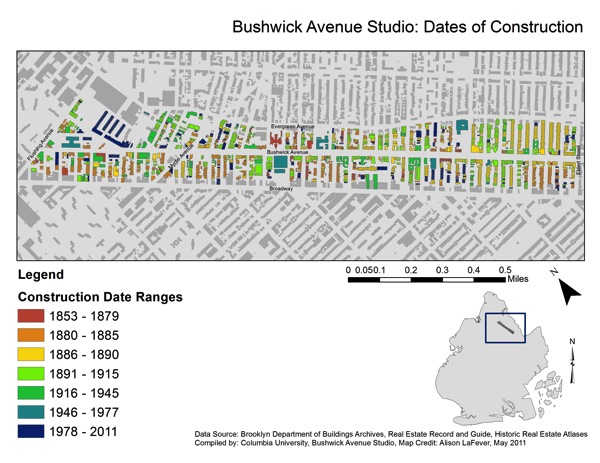
Source: Columbia Historic Preservation Studio, 2011
A comparison of actual building dates to PLUTO’s purported dates highlights the problem. In 2011, the students in my Columbia preservation studio prepared a preservation plan for Bushwick Avenue from Flushing Avenue south to Eldert Street. The students researched 1,944 parcels in the study area and identified relatively accurate dates of construction for almost all of them. They did this by researching the original block and lot files at Brooklyn DOB, poring through old issues of the Real Estate Record and Builders’ Guide and looking at historic insurance maps. Through this process, they were able to identify precise dates for about 1,500 buildings and narrowly-bracketed date ranges for another 400 or so (even so, their data is surely not 100% accurate either). The results of that effort can be seen in the map above, prepared as part of their larger plan [PDF].
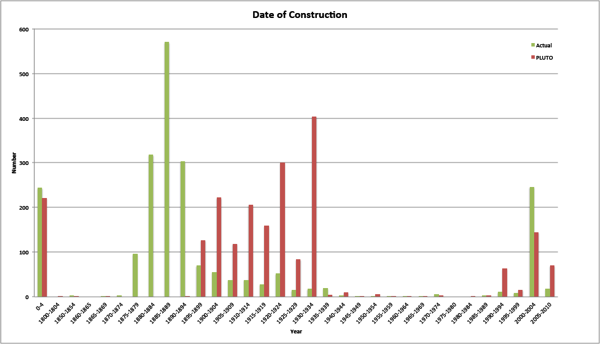
Data source: Columbia Historic Preservation Studio, 2011; NYC PLUTO, 2010
Above is a comparison of the actual dates of construction and the PLUTO estimated date of construction for all 2,175 parcels in the study area. Just as with the larger Brooklyn dataset, the City’s data for Bushwick Avenue skews to the period 1895 to 1934 (really 1899 to 1931). But Bushwick Avenue is not a 20th century street – even someone not versed in architecture history should be able to tell this just by walking down the street. Sure enough, the actual dates of construction shift the curve well to the left, with the majority of the buildings on the avenue having been constructed between 1880 and 1894. Which makes sense if you look at the buildings.
Not every neighborhood will have this exact distribution of building dates, but for much Brooklyn and Manhattan and some parts of the other boroughs, a distribution that skews to the early 20th century is just plain wrong. Used properly, the PLUTO data for building age can be useful, but only if you define 1901 as “everything before 1901” and then take the rest with a (smaller) grain of salt.